skip to main | skip to sidebar

Piekolie Wereld

De Historische Verschuiving van ons Wereldbeeld tijdens de XXI Eeuw:
Piekolie en de fatale financiële, economische en ecologische gevolgen
--
The Historic Paradigm Shift during the XXI Century:
Peak Oil and the financial, economic and ecologic consequences

donderdag 22 januari 2009

The Scariest Chart Ever

If this doesn't give you pause, nothing will.

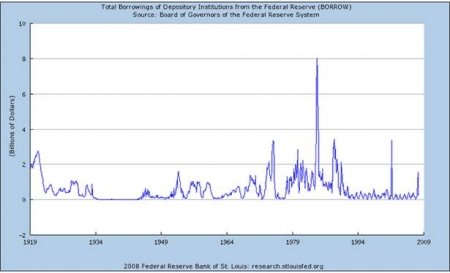
Here is a chart of federal borrowing through Dec. 2007.


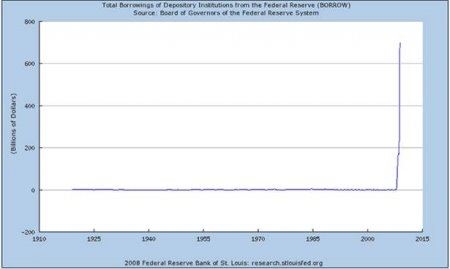
Now, same chart through December 2008.


Anyone still think there are not some rough patches down the road?
Gepost door Mansoon op 09:15
Nieuwere post Oudere post Homepage

Blogarchief

  • ►  2011 (15)
    • ►  november (1)
    • ►  oktober (1)
    • ►  september (2)
    • ►  juli (3)
    • ►  juni (2)
    • ►  februari (2)
    • ►  januari (4)
  • ►  2010 (61)
    • ►  december (4)
    • ►  november (5)
    • ►  oktober (6)
    • ►  september (4)
    • ►  augustus (4)
    • ►  juli (8)
    • ►  juni (10)
    • ►  mei (3)
    • ►  april (3)
    • ►  maart (6)
    • ►  februari (5)
    • ►  januari (3)
  • ▼  2009 (53)
    • ►  december (2)
    • ►  november (2)
    • ►  oktober (9)
    • ►  september (4)
    • ►  augustus (8)
    • ►  juli (1)
    • ►  juni (3)
    • ►  mei (4)
    • ►  april (8)
    • ►  maart (3)
    • ►  februari (5)
    • ▼  januari (4)
      • The Scariest Chart Ever
      • The Five Stages of Collapse
      • The Lint Age
      • The Foundation

Links

  • Club Orlov
  • Cryptogon
  • Daily Reckoning
  • Dieoff.org
  • Global Research
  • Golden Jackass
  • ISGP
  • LEAP 2020
  • Life After The Oil Crash
  • Post Peak Living
  • Rice Farmer News
  • The Automatic Earth
  • The Daily Bell
  • The Oil Drum
  • Vigilant Citizen

Pagina's

  • Startpagina
  • Vlaamse Onafhankelijkheid
 

Counter

Free Counters
Free Counters